Perth, Western Australia is a sunny place, as any local will confirm. Combined with subsidised buyback tariffs for electricity returned into the grid, this has resulted in many local households now having an array of solar panels on their roof.
What most will intuitively understand is the production of these panels varying over the year. That's a combination of the differences in average cloud cover on the one hand, and on the other hand the amount of energy that falls down on the panel from the sun varying over the year due to the tilted axis of the earth.
Combined, this results in significantly different levels of energy available on our roofs throughout the year.
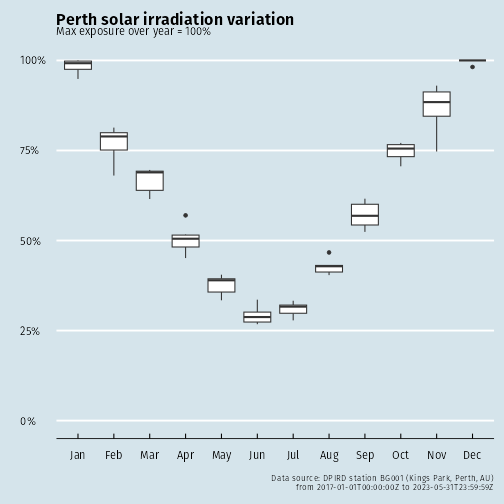
Figure 1: Perth solar exposure variation
Table: Average solar exposure per m<sup>2</sup> in Kings Park, Perth Jan 2017 to Jun 2023.
| Month | Jan | Feb | Mar | Apr | May | Jun | Jul | Aug | Sep | Oct | Nov | Dec |
|---|---|---|---|---|---|---|---|---|---|---|---|---|
| MJ/m<sup>2</sup> | 949,152 | 741,432 | 642,187 | 484,428 | 362,085 | 280,690 | 297,863 | 411,215 | 548,154 | 718,831 | 831,845 | 958,651 |
Right now in June, we're at the low point for the year in expected yield from a solar panel, with just about a third of the energy being generated that we can expect to get in Dec.
Posted on Sunday 11 June 2023 at 13:27